Hey, anyone remember that college football bowl pool spreadsheet I did last year?
Well...Merry Christmas! Here's the same one updated for this season's match-ups. My gift to you.
0708_College_Bowl_Pool_worksheet.xls
Speaking of Christmas gifts, be sure to check out the Excel_Geek line of merchandise I've got up on Cafe Press. This guy's got one...man does he look cool.
Later,
Excel_Geek
Thursday, December 13, 2007
2007-2008 College Football Bowl Spreadsheet

Friday, October 26, 2007
ExcelGeek.com blog updates look!
Did you notice? If you didn't, you should get your eyes checked or drink more Redbull.
I stayed up late the other night and completely redesigned the blog! Well, actually, the reason I did it was to have one of the new(er), fancy XML Blogger templates, as opposed to the old(er) HTML templates, so I could have access to a host of better administrative features.
I started with "Rounders 2" (by Douglas Bowman, www.stopdesign.com), but significantly modified it, changing colors to be more reminiscent of the old look (see here).
I uncluttered it significantly, added in a fancy label cloud (thanks to phydeaux3), and even made it so that viewers can hide the Meebome Chat window if they're moderately (or more) annoyed by it (thanks to Craiggers for withstanding my numerous idiotic javascript questions).
Anywho...hope you like it.
Sunday, October 14, 2007
Pulling Images into Excel
The other day I did a quick $50 Project for a guy who asked if there was a way to automatically pull images into a spreadsheet based upon a values in a range of cells...you know, like for an inventory list or something.
Sure.
Actually, the VBA code involved is quite simple -- one line really. Let's say that the value in the cells is actually the name of the image (only without the file type extension) that you want to pull in. That code might look like this:
ActiveSheet.Pictures.Insert(<IMAGE_DIRECTORY> & "\" & cel.Value & ".jpg").Select
Pretty simple. Now, one tip that I'd pass along when working with images or other similar objects via VBA in Excel is to immediately rename the object, since it can become cumbersome trying to figure out if it's called shape1 or shape2 or shape 300, etc. So I would rename the image to that same value in the cell, so it's easy to reselect later if you need to:
Selection.Name = cel.Value
It does get a bit more involved, though, as you probably want the images to fit nicely in a certain column and/or row. To do this you first have to determine what the height and/or width is (and adjust it if you wish) and then determine what the dimensions of the image you've imported are and adjust them to fit. Also, you probably would want to check to see if an image already exists and delete and replace it.
The code to do these things is pretty straightforward. If you'd like to learn how to do these sort of things, I'd encourage you to record these sort of actions using the macro recorder in Excel and then look at the code and see how it works. Actually, that's the way I'd suggest you learn pretty much anything VBA in Excel. That's what I do...
I added some of this other functionality to the file, which, Excel_Geek Insiders, is on it's way.
Later,
Excel_Geek
Wednesday, September 19, 2007
I found another Excel geek at Dreamforce
So this week I've been out in San Francisco at Dreamforce '07, and I've learned some incredible things about Salesforce.com -- better ways to extend what we're already doing and some cool new features do to hit this winter. I've also met some amazing people. One such person is Ezra Kenigsburg, a consultant and Salesforce.com Data Architect out of Chicago working in the Professional Services group.
Turns out Ezra is a bit of an Excel geek, too. Actually we met at a breakfast discussion of analytics, and he was mentioning that he was "...a bit of an Excel geek..." so I jumped in and said, "Oh, really? Well, I am THE Excel_Geek." We got along just fine from then.
Once we were finished chatting about Salesforce stuff, we jumped on this blog, so that he could see what I was all about. The last post on "Filling in the blanks..." was up, and a second or two after he read it, he showed me a far better, simpler way of doing was I had done.
Ever heard of "Edit --> Go To... --> Special"? Well, it's a pretty cool, little known feature. What you can do is select a large range, like we were dealing with in "Filling in the blanks..." and go to Edit --> Go To... --> Special, and select "Blanks". This will select only those cells within the range that are blank. (There are many other cool options, too, like selecting only formulas, comments, conditional formatting, data validation, etc. Oh the possibilities! Anyway...) Once you've got only the blank cell selected, if you click up into the Formula Bar and type in a formula you want -- in our "Filling in the blanks..." case, we wanted to average the four cells immediate left -- and instead of hitting <Enter> you'll hit <Ctrl> + <Enter>, which will copy that formula, adjusted for relative ranges, into all selected blank cells. Wow. The simplicity. Wanna make 'em all red now, simply Format --> Cells... --> etc.
Thank you, Ezra. Truly a pleasure to meet you.
Wednesday, September 12, 2007
Filling in the blanks - Interesting $50 Project
Recently I completed a $50 Project for a client who had what could be a fairly common data problem -- missing data points.
This client has large tables of data over a series of dates, but for some reason he's missing data points for some of the dates. To fill them in, his plan was to simply average the values of the four prior dates. In cases where the blanks occurred within the first four dates' data points, he was just going to put zeros.
The formulas needed to do this were simple, but there was a problem: His data table was very large. It would take him a long time to copy-paste that formula over and over.
"Isn't there a way to use to Excel's replace function to find blanks and replace them with these formulas?" my client asked. "Oh, and it'd be nice if when blanks were replaced, the font color was changed, so I can see which points are averages and which ones are authentic data values."
Here's kinda how my thought process went as I tried to solve this problem:
Hmmmm.
Well, the replace function idea wasn't really a go, because even though you can use it to replace blank cells with formulas (simply leave the "find what" field blank, put the formula -- e.g. "=1+4" -- in the "replace with" field and select the "match entire cell contents" option) there's no way to specify which cells to reference in the formulas. Plus the replace function, by itself, couldn't change the font color. You could use conditional formatting and change the font color if the cell contains a formula, but wait...there's no built in Excel formula to test if a cell contains a formula...and you can't just look to see if the leftmost character in the cell is a "=", since that evaluates the value in the cell (the result of the formula) not the text of the formula. I could have just wrote a custom function in VBA -- say, called ISFORMULA -- to evaluate whether or not the cell contains a formula. That VBA might have looked something like this:
Function ISFORMULA(CELL_REF as Range)
If Left(CEL_REF.Formula, 1) = "=" Then
ISFORMULA = True
Else
ISFORMULA = False
End If
End Function
But none of that mattered because, again, the replace function path wasn't going to work, so I instead wrote a relatively simple macro that would allow the user to select the range of cells he or she wanted to check for blanks and replace them with either zeros (if they were in the first four date columns) or formulas to average the prior four date columns' values. Then if the blank was replaced with a zero the font would be changed to green, and if the blank was replaced with the average formula, the font would be changed to red.
In the end, the result was a solution that didn't make any material changes to what the client was already doing, but solved his problem with the click of a button.
Insiders Subscribers, your file's on the way. I also made some explanatory notes in the spreadsheet in a comment and put lots of explanatory comments in the code itself.
Enjoy.
Excel_Geek
Oh, and did anyone notice two shiny new features (one temporary, one permanent) on the blog?
- An image and link on the left side promoting a charity fundraiser my wife and I are involve with in the near future, and
- A Google search feature on the right side. Now you can easily look for those oldie but goodie posts from way way back...
Friday, August 24, 2007
I Geeked Out on Redbull Roshambull
So what does the Excel_Geek do late at night when he can't sleep, but isn't motivated enough to work on one of the countless other Excel projects he's got on his plate?
He plays rock paper scissors on Redbull Roshambull, a Facebook app created for Redbull by the guys down at Archrival.
Being an Excel_Geek, though, I couldn't just play, right? I had to better understand how strategy comes into play. Now I'm not talking about throw strategy -- that is when to throw rock vs. paper vs. scissors. There are countless strategies you could enact based upon things like an opponents past five matches, or throw by throw tendencies over their history, or overall throw tendency, or the overall throw tendency of the total Roshambull userbase (if you had access to that data, which I do not) or even strategies not based upon tendencies, but on the weather or day of the week or even random. This is not what I concerned myself with.
I have my own throw strategy I've been toying around with, and so far, it's lead me to a fairly consistent 55-59% win rate. (Thank you, thank you.) For this exercise, though, I assumed away a player's overall winning percentage, and actually looked across a range of winning percentages, from 50% to 60%. I didn't concern myself with win rates lower than 50% -- those which we'll call "losers" -- since to me the obvious best strategy for "losers" is to simply give up and not play. ;) Seriously, though, I thought this material would be much more relevant to those who believe they have some ability to beat the 50:50 odds inherent in this game or at least tie them. Maybe some other time I'll look at -- ahem -- solid "loser" strategies for Roshambull...
What I wanted to explore was betting strategy. Say your goal is to amass as many creds as possible. Given that you start with 20 creds (and if you lose all your creds you can start over with another 20) and you can bet as much or little of that as you like -- either directly to your friends or using the Match Finder -- what would be the best strategy for how much you should bet on any given match based upon how much you have and what your overall winning percentage has been? You know what I mean? Is it best to continually put it all on the line or should you pull back after you've gotten so many?
So I decided to look at two betting strategies:
- All-In-All-The-Time, which is just like it sounds. It assumes you can always find an opponent to take on at any given level of creds, and you bet it all on every match.
- Match-Finder-Only, which assumes you'll only use the Match Finder feature and bet as much as you can for any given cred level. Example: if you had 40 creds, you'd bet 20, since you don't have enough for a 50 cred match yet. This strategy has the built-in characteristic of pulling back once you've amassed so many creds, since you can only go up to 2,500 cred matches.
You following this?
Now 500 trials is a lot, but much less than infinity, so we're not talking true probabilities here -- I'm no actuarial scientist or even really that good with statistics -- but 500 trials is fun to look at and should give us all a feel, right? Plus, I simulated nearly 3 million matches to get this data, and even with a relatively speedy processor in my laptop, this took almost an hour's worth of processing time!
Here's an example of what the results looked like for the "Match-Finder-Only" strategy, assuming a 57% win rate (in histogram form):
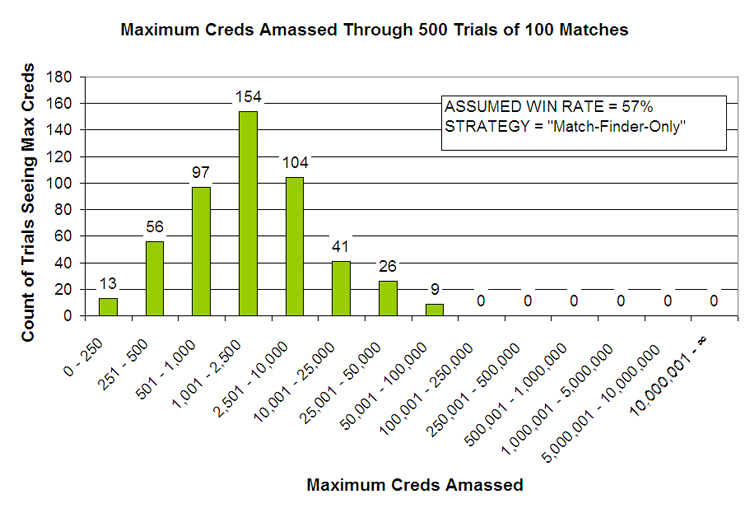
(Click on the image to pop open a new window or tab with a larger version.)
That data breaks down in to the chart below, which shows the likelihood (in that 500 trial experiment) that a player would have ever hit the various maximum cred levels:
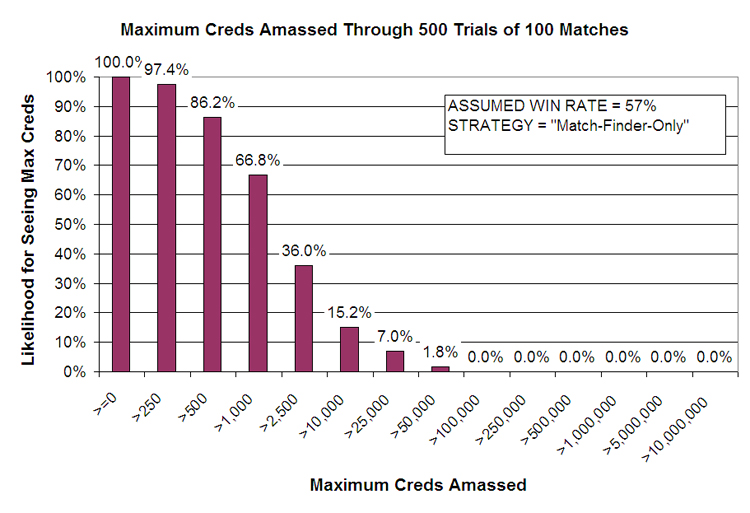
(Click on the image to pop open a new window or tab with a larger version.)
Over these 500 trials of 100 match strings, there was a 15.2% chance the player would have amassed more than 10,000 creds using this strategy. Interesting? (If you said or though "Yes" you're probably a geek, too.) Just wait, now we'll look at the corresponding charts for the other "All-In-All-The-Time" strategy:
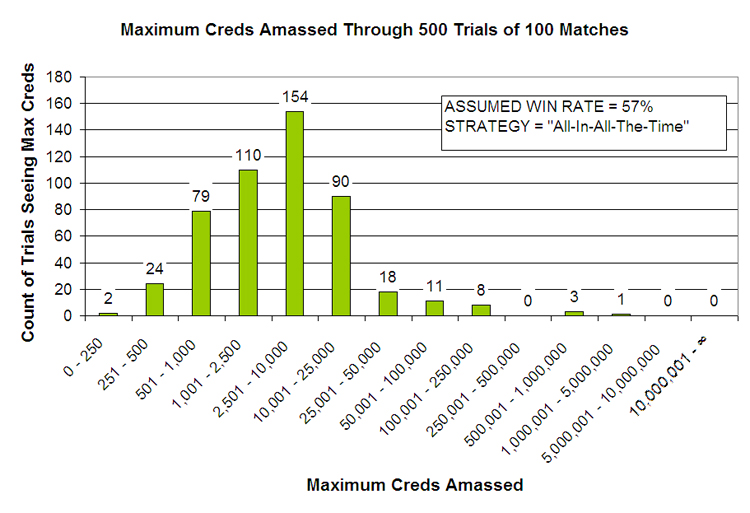
(Click on the image to pop open a new window or tab with a larger version.)
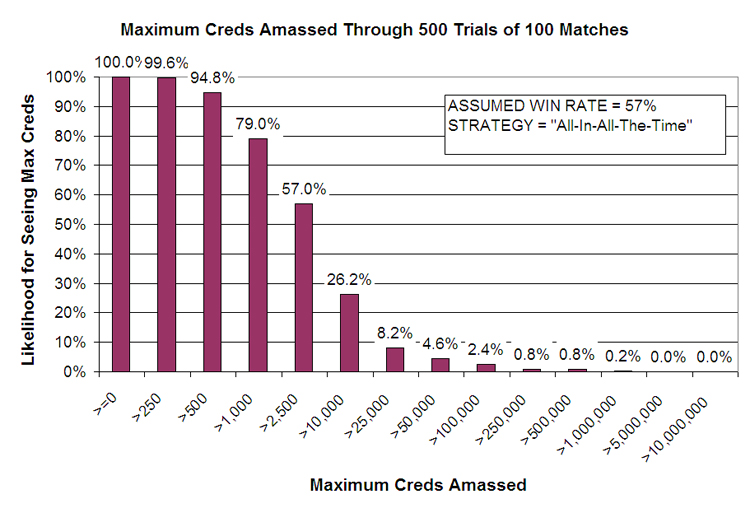
(Click on the image to pop open a new window or tab with a larger version.)
Interesting now? See how everything has "slid" to the right a bit? Notice how over these 500 trials the player using this strategy has a 26.2% chance of amassing >10,000 creds -- an increase of 11%. Also, notice that now the player has nearly a 1% chance of amassing over 500,000 creds! What this effectively means is that the player has nearly a 1% chance of hitting a 16 match win streak during any given 100 consecutive match period if he or she has a win rate of 57%. Huh... Just the other day I went on a 12 or 13 match streak myself...too bad I wasn't using this betting strategy then.
If we pick one point along these graphs -- say hitting >10,000 creds -- and plot the data for the two strategies' results over multiple assumed win rates, we get something that looks like this:
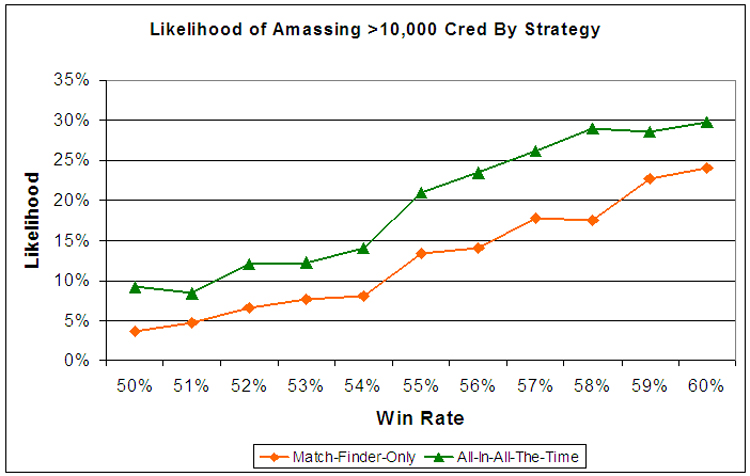
(Click on the image to pop open a new window or tab with a larger version.)
At every win rate from 50% to 60% the All-In-All-The-Time strategy outperforms (during this 500 trial experiment). Similar results would be seen at other relatively higher points along the "maximum creds amassed" scale. I should also note that while we really didn't see it over this 500 trial experiment, I would expect to see relatively greater volatility for this strategy, given it's propensity for higher and higher wager amounts when long winning streaks do occur.
One other factor that I thought would be interesting (to me at least) is the impact on the number of consecutive matches played on the results. It stands to reason that the more matches you play using the strategy, the more likely it is that you'd see a winning streak that could result in higher maximum creds amassed, so not surprisingly, here's the two strategies over 10, 25, 50, 75, and 100 matches:
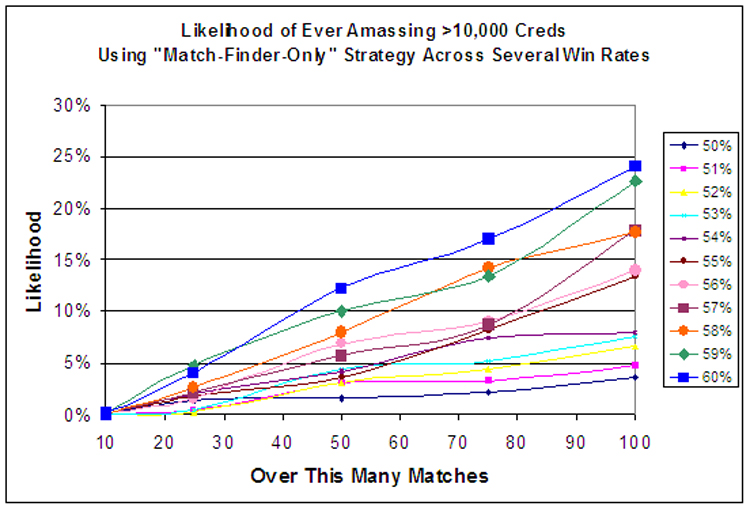
(Click on the image to pop open a new window or tab with a larger version.)
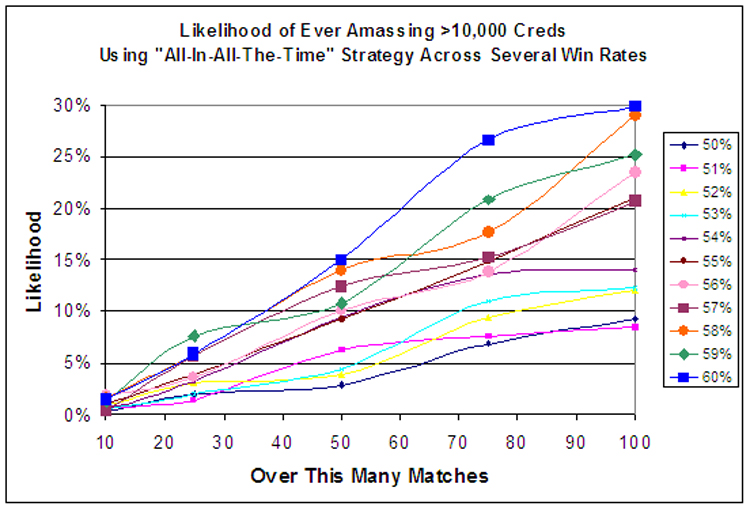
(Click on the image to pop open a new window or tab with a larger version.)
You can see how the likelihoods are pretty slim when only playing 10 matches. After all it takes a streak of 10 (all ten would have to be wins) to go over 10,000 creds using the All-In strategy and 13 (impossible with on 10 matches) using the Match-Finder-Only strategy. The likelihoods grow, however, as you move up to 100 matches, and I assume they'd continue to grow and eventually plateau as we moved past 100 matches to 1,000 matches and beyond.
What does this all mean? What am I concluding?
I think I can only conclude that if you want to amass huge numbers of creds in Redbull Roshambull, in order for probability to be on your side you should...
- Play as many matches as possible, and
- Go all-in all the time, baby!
What have you got to lose?
Later,
Excel_Geek
Tuesday, August 21, 2007
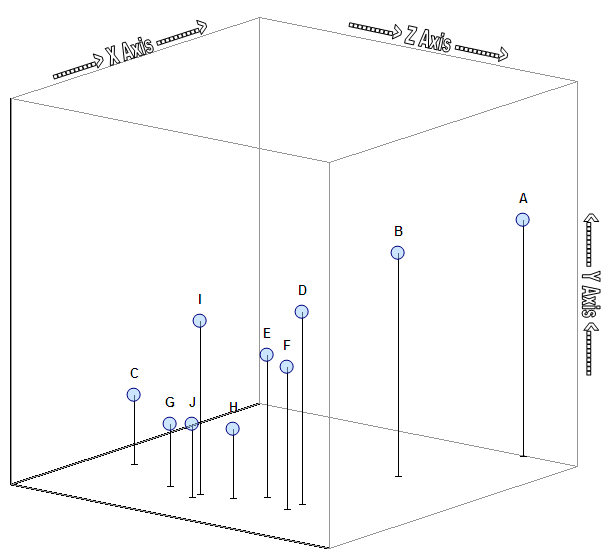
3D XY Scatter Plot Graph
Hey everyone.
I just recently did a quick project for a guy who wanted to visually represent data along three dimensions. All I can say is thank goodness for Andy Pope and his charting wizardry!
By using Andy's "3d XY-Scatter" as a starting point, doing some clever formatting, and adding in some vertical error bars, I think I've accomplished a pretty decent looking 3D "push pin" sort of representation. I even used a little known trick to add transparency to the "heads" of the "pushpins", so that when they're close together, you can still distinguish them. Here's what it looks like:
(Click the image to open up a new tab/window with a larger version.)
Now, it'd be nice to add in the ability for the graph to automatically "resize itself" -- i.e. change the values that create the reference "cage", axes, and actual minimum and maximum X and Y axes values -- based upon the data to be plotted and the rotation of each of the axes. Maybe I'll work on it if someone else wants that. Just too many projects going on at once these days.
Insiders Subscribers, your file is on its way!
Later,
Excel_Geek
Friday, July 20, 2007
Renaming files in a directory
I recently completely a handy little $50 Project that ended up being immediately useful to me: a simple tool to rename a bunch of files in a given directory automatically.
Why might this be useful? Well...
- What if you use some program that outputs a bunch of text files that you use later for something else, but it gives them archaic names and you want to give them all (there could be hundreds) more intuitive names?
- What if you've got a long list of Word documents that you want to convert to text files?
- What if you've got a lot of files relating to a project named "Secret Project" and all of a sudden the project gets renamed "Super Secret Project"?
- What if you use Salesforce.com and you exported a whole list of attachments, but what you're left with is a bunch of hexadecimally named files with no file extension with an accompanying Excel file associating those hex names with their real English names and file extensions? (This, you might have guessed, is the issue I found myself with nearly immediately after having completed this project for my client, who was dealing with the first issue.
What I created is a simple file where the user can input the path to the directory in which the files are stored. Then the user lists the names of the files to be renamed in one column, and the new names and/or filetype extensions for each file in another column. Using the File System Object the macro finds the files in the list and renames them accordingly. It's remarkably fast, too.
To my Insiders subscribers, the file's on it's way.
Later,
Excel_Geek
Oh, and if you didn't already notice, I've decided to offer my originally created content on my blog to anyone who'd like to use it via a Creative Commons license. Do what you like with it -- commercial, non-commercial, make derivatives, whatever -- provided you attribute the original to me. I'm doing the same within the code modules in the files I send out to my Insiders subscribers. Enjoy!
Thursday, June 07, 2007
Excel & VBA on a Mac: Look out for Missing Acrobat Distiller
So I just recently completely my first Excel + VBA project for a Mac user. Wow.
It was a Private Project, so I'm not at liberty to share the file with my Insiders subscribers or talk in too much detail about what exactly I was doing, but I did want to relay to my loyal readers the nature of one of the quirks I encountered on this project.
First and foremost is that the script would not run on the Mac. At all. It popped up some obscure message about "Compile error: Can’t find project or library". I struggled long and hard with this. It seemed that some reference was not selected on the Mac user's computer in the Visual Basic Editor --> Tools --> References... menu. Only after having lunch with a good buddy of mine so I could play on his Mac Book Pro, did I see something that my client told me about, but that didn't register immediately with me: She told me that the references checked were...
- Visual Basic for Applications
- OLE Automation
- Microsoft Office 11.0 Object Library
- MISSING: Acrobat Distiller
Now the project initially had involved the possibility of automatically creating some .PDFs from the worksheets (though, in the end we scrapped that aspect), so I misunderstood that she was telling me that "Acrobat Distiller" (which we would have needed to create the .PDFs) was missing from the list. But NOOOOO. She was telling me that it was actually in the list as "MISSING: Acrobat Distiller" and checked.
When I unchecked this reference on my friend's Mac, all was well. The script ran just fine.
When I worked with my client and had her do the same, it worked on her Mac, too.
How about that? Now, there are also some other odd differences between running Excel in PC vs. Mac, such as inconsistency in the amount of print space rows and columns take up, which we had to work out separately, but I thought most interesting was this odd "MISSING: Acrobat Distiller" issue. I'm sure others have faced the same issue, but I never found any references to it on the web when I searched, so here it is.
Have a good day,
Excel_Geek
BTW, (and this is a completely unpaid and unsolicited endorsement), for those of you PC users who who regularly do collaborate with Mac users, and vice versa, I recommend GatherPlace for sharing desktops, etc. When GoToMeeting failed, GatherPlace shined.
Thursday, April 12, 2007
Automation Work for eSignal Stock Trading Software User
Recently I was contacted by a technical trader who uses eSignal to scan for and execute stock trades. He had a problem for me to solve, but first I'll need to give some explanation as to what he's doing, though I must admit, he was rightfully secretive about many of the details:
Basically, each morning he uses Yahoo Finance's Stock Screener (an effective and free tool) to identify a group of stocks to watch that day, based upon a certain set of technical factors that he's developed over time (this is one secret part). He actually does this four times, each with a different set of factors. When he's done, he's got four lists of stock tickers, each of which might typically contain 20 to 50 line items, which he can export to a CSV file and open in Excel. Then what he does is create an advanced chart in eSignal for each ticker in each of the four lists, each list having a unique chart configuration and associated with unique and proprietary formulas or "studies" that he's created over time (here's the other secret part) that automatically execute trades on a stock when certain conditions are met.
The problem is that most of the really "good" trade opportunities happen very early in the morning after the opening bell. Meanwhile, he's manually creating charts for 80 to 200 tickers, which takes an hour or so, so he's missed the bulk of the good trade opportunities.
"Excel_Geek, can you help me automate the creation of these charts quickly so I don't miss all the good trades?" Sure.
So what I'd need to do is run down a list of ticker symbols in a spreadsheet, and then create a new chart using the right configuration (of the four he uses) in a whole other software program -- eSignal -- for that ticker. Huh...how do I do that?
So I got online with the technical support people for eSignal and asked some dumb questions. "Is there a way to automate the opening of a large number of advanced charts programmatically?"
"No."
Hmmmm. Now I started reaching, "How about using Shell commands? Can I do it with Shell commands?"
"No."
Really? "'No' like 'you shouldn't do that' or 'no' like 'that is not possible'?"
"It is not possible."
Really? I needed to know who I was dealing with, "Do you have a programming background?"
"No."
That's it then. I'm going to figure out how to do it, and it turns out, that it can be done, and I did it.
What I built is a spreadsheet where this trader can copy-paste in his lists of tickers, click a button, eSignal is fired up, and all of the charts are opened. Instead of an hour or so, it takes about 15-20 seconds. Not bad. He'll get those good trades now!
On the drawback side, we learned that eSignal is a bit resource-hungry, particularly when using advanced charts. With an AMD Athlon 64x2 Dual core processor 4600, 986 MHz, and 2 GB of RAM it starts to choke on around 150-160 charts open at once. Perhaps with some additional RAM and tweaking the paging file settings, we can get some better performance, but in the end, 150 simultaneous opportunities to find profitable trades is not too shabby.
I must disclose to you all that this was a Private Project rather than a $50 Project, so I won't be sharing it with all of my loyal Insiders subscribers. Sorry. However, my client was more than happy to let me generally write about the project here, and he's even expressed interest is licensing it to others if they're interested.
Interested? Shoot me a line.
Later,
Excel_Geek
Sunday, March 11, 2007
Get your March Madness Bracket Here
Ever since my post describing the NCAA basketball bracket spreadsheet I created, I've been getting asked, "Are you going to post that file so that we can use it?"
Sure.
I even filled in the teams picked today ("Selection Sunday") and you can download it all for the bargain basement price of $3.00. Just click here to send payment via PayPal (major credit cards accepted), and you'll be taken to the download page (Zipped file). OR...if you'd rather, you can download the file here, then email for the key code once you've sent $3.00 PayPal to ehunzeker@gmail.com.
Some of you might be wondering why I'm rolling out a $3.00 NCAA basketball bracket spreadsheet. Why not just give it away for free?
Well, here's a little secret: what I really wanted to show off to you -- many of you being Excel geeks in your own right -- is a terribly handy little piece of programming I've been working on: a super simple, self-contained means for locking down standard Excel spreadsheets for licensing purposes.
When you download and open the NCAA basketball bracket file, you'll be prompted to email me a "License Lock Code" that is generated when you open the file (be sure to enable macros). I'll then send you a corresponding "License Key Code" which will open up the file for your use. Oh, and if you think you can pay once and share it with your friends -- it's just a spreadsheet after all...should just be able to copy it and share it with whomever you like, right? -- not so fast. When your friends open the file on their computers, they'll auto-generate a different lock code, and will be prompted to get their own unique key code (and pay, too). How about that?
So...for all of you March Madness crazies, enjoy the download for less than the price you might pay for a decent cup of coffee, and for all of you Excel programmers who've been looking for a way to protect the brilliant spreadsheets you've created over the years, drop me a line if you'd like to learn how I created this little security system. I'm currently working on commercializing it, too.
Later,
Excel_Geek
Monday, February 26, 2007
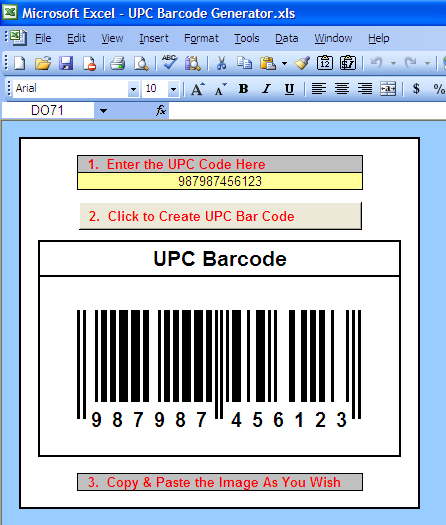
UPC Barcode Generator
Here's a recent $50 Project I completed for a client: a simple, straightforward UPC barcode image generator. Now, many of you might be groaning, thinking, "Come on, Excel_Geek, there are hundreds of barcode add-ins and software packages out there that work with Excel." And you're right. What's wrong with them? Nothing really. This client simply wanted his own ultra-simple Excel-based solution -- something he could input a number into and get an image he could use.
Here's a look at what I built:
(Click on the image above to open it larger in another window.)
How's it work? Basically I created a range containing cells with very narrow column widths and used conditional formatting to change the background color of the cells to either black or white, depending upon the value in the cells (either "TRUE" or "FALSE") which I obtained using VLOOKUP formulas to grab the appropriate value for each digit in the code from a table containing them.
Then once the "live" version of the barcode is set, I use Excel's little known "camera" feature (copy a range then hold down shift when selecting the Edit menu and you'll find it -- this feature is gone in Excel 12 :-( ) to copy the range containing the barcode and paste it as a copy-pastable image.
It was remarkably simple once I understood how UPC barcodes work.
To my Excel_Geek Insiders (who'll be receiving this file soon as part of your subscription), unhide the hidden rows if you really want to to see the "guts" of how this works.
Later,
Excel_Geek
Thursday, February 08, 2007
Comparing Phrases - Google Adwords Application
I just completed a $50 Project for a client who wished to compare a list of phrases to see if they appeared in another list, only the thing was it didn't matter what order the words in the phrases were.
So...if the phrase "big boy eats cake" was in the second list, "boy eats big cake" would result in a match. What is important is that both phrases contain exactly the same words...no more no less, but the order is irrelevant. I believe the application for this type of function was to make sure that a list of keyword phrases, say for a Google Adwords campaign, didn't contain any phrases that would be "duplicates" for that purpose.
Using formulas to parse out the individual words in the phrases and a little bit of VBA code, I think I've come up with a simple-ish solution to this little problem.
Later,
Excel_Geek
Sunday, February 04, 2007
Okay...Who's Ready for a New NCAA Basketball March Madness Bracket?
I can't tell you how many requests I get, from close friends and family, as well as from readers around the United States and internationally, for an Excel-based NCAA men's basketball March Madness tournament bracket. Well, here's a pretty neat one I whipped up just in time for the tournament.
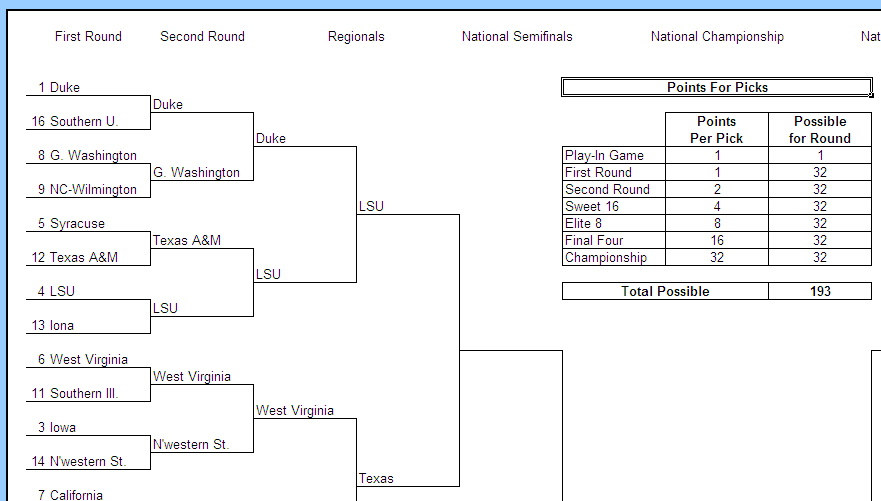
The workbook consists of three sheets:
1) The "Setup & Actual Results Bracket" worksheet is where you input the teams who've made the tournament, record the results of the games as they are played, and also where you can set how many points each correct pick is worth by round. The image below is a glimpse of this worksheet (well, at least the upper left quarter of it). Don't worry, this is laid out so that you can nicely print the entire bracket on one 8.5" x 11" page.
(click on the image to open it up larger in a new tab/window.)
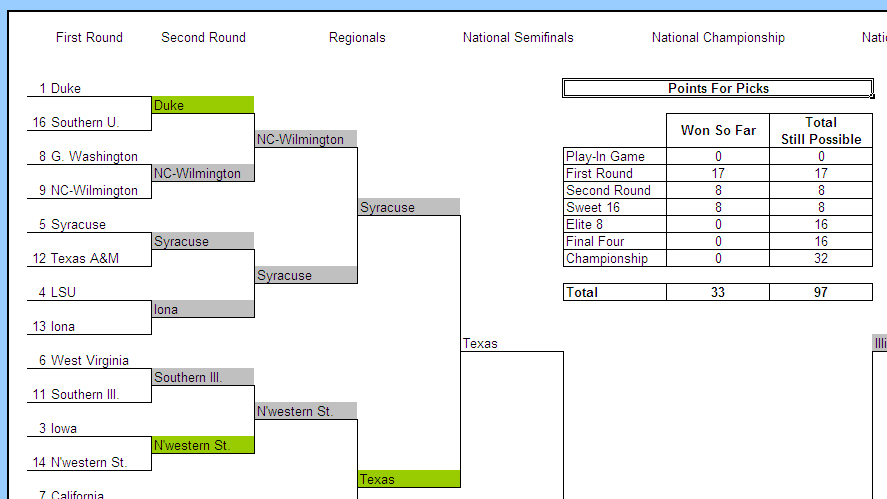
2) The "My Picks & Points Bracket" worksheet is where you would predict the winners of each game. Using data validation, I've managed to automatically make each cell into which you make a pick only allow the teams playing in that game. Then, using conditional formatting, I've made it so that correct picks (once you've input the actual results in the other worksheet) show up as green, and incorrect picks show up as grey, AND eliminated teams that you've picked to win subsequent games will also show up grey. Finally, this sheet contains an up-to-date total of the points you've won, as well as the total possible points still remaining based upon your picks.
(click on the image to open it up larger in a new tab/window.)
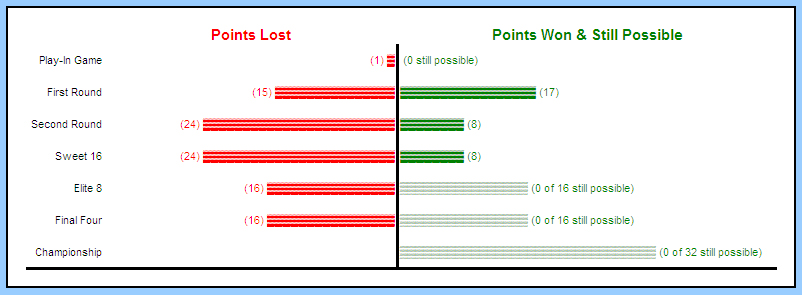
3) The "My Points Chart" worksheet contains an in-cell tornado chart (I admit it: I've got a thing for these crazy charts!) displaying round-by-round performance.
(click on the image to open it up larger in a new tab/window.)
Now, the way I've set up this file, it's pretty much self-contained for a single person to track their picks and points, but I can certainly envision using this as the basis for a complete system in which one "master file" is created to track the results of the actual games as the are played and to set the number of points awarded for correct picks in each round. Then any number of "player files" are created and emailed to each person to make their picks and email back to the person managing the system. Then the "master file" could simply reference the results in each "player file", displaying a summary or a leaderboard, if you will. Could be pretty cool.
To my growing Excel_Geek Insiders subscribers, enjoy this file...it's on it's way. To those of you who haven't subscribed yet, did you know that for only $39.95 per year, you get copies of all Excel_Geek $50 Projects I do for the year, as well as copies of these special little projects I just decide to do? It's true. Sign up today!
Enjoy the tournament!
Excel_Geek
UPDATE: I released this file for download. See comments here. Download the file here.
Tuesday, January 30, 2007
Did you notice? www.excelgeek.com!
Anyone notice that as of yesterday, I'm now blogging on my own, shiny, new domain: excelgeek.com! I'd like to thank Rick for being so generous and cooperative in transferring this domain to me, and I'd like to let you all know that I plan to test out my new-found-but-still-lousy web design skills to create a "real website". I'll be keeping the blog, too, but I have some plans for other stuff. That's why I'm redirecting from www.excelgeek.com to blog.excelgeek.com for the blog currently.
Well, I'd better get busy on that new website...
Later,
Excel_Geek
Monday, January 22, 2007
Heat Charts, Another Creative In-Cell Charting Technique
I recently completed a $50 Project for a client who wanted to create visual "heat charts" from data in a matrix. What's a "heat chart" you ask? Well, basically, it's a color-coded representation of the relative data values contained in a data set. What?
Ok, so say you've got four columns of data in four rows: The columns represent the four seasons of the year, and the rows represent four different cities around the world. The data in the matrix might be the average midday temperature in each of those cities over each of the four seasons. A heat chart would represent this data showing the hottest (highest) value as bright red, and the coldest (lowest) value as deep blue, and everything in between would fall on that spectrum from red to orange to yellow to green to blue. Now, obviously, a heat chart can be used to represent any data, not just temperatures...
Here's a picture so you can see what the heck I mean:
(Click on the image to open it up larger in a new window.)
How's it work? Well, basically I just use some formulas to convert the values in the matrix into an "index" from 0 to 100, where 0 is the lowest value in the chart (or another user-specified minimum value) and 100 is the highest value in the chart (or another user-specified maximum value), and all other values in the chart fall somewhere, proportionately, in between.
Using the values in this "index" version of the chart, (using VLOOKUP) I reference each the RED, GREEN, and BLUE values for the RGB color representing that index value from a predefined COLOR SPECTRUM table.
Then, with a macro in the ThisWorkbook object, I automatically set the background color (using the RGB property in VBA -- i.e. "cel.Interior.Color = RGB(RED_VALUE, GREEN_VALUE, BLUE_VALUE") every time the sheet is changed.
This together with some general cell formatting, data validation, and some other macros to help automate adding and subtracting rows or columns, and there you have it.
Pretty cool if you ask me.
Later,
Excel_Geek

Subscribe to:
Posts (Atom)


