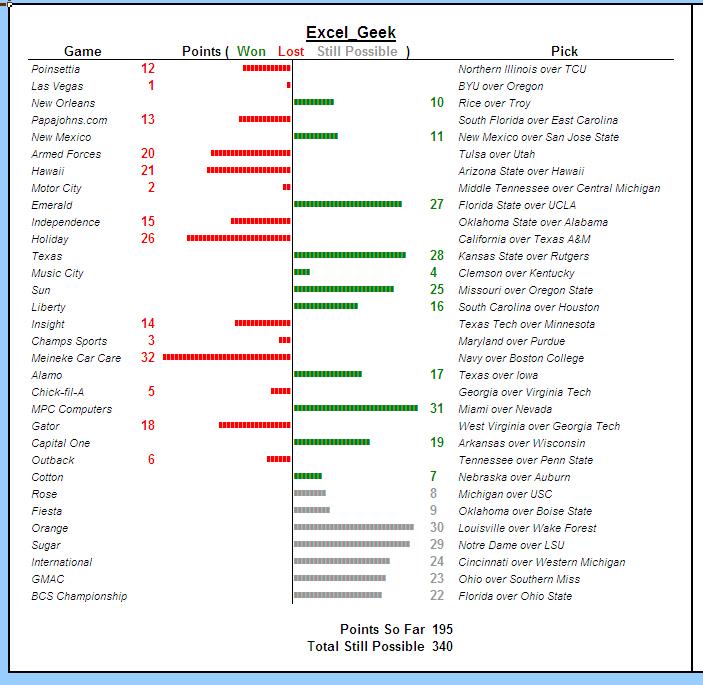
Yesterday a buddy of mine requested a project. He's a college football (pro football, any football, any sports, really) nut, and so he's involved in setting up a bowl game pool. What he wanted was a simple spreadsheet to keep track of everyone's picks, as well as how many points they allocated to those picks. Then as the games are played and winners are known, the sheet could be updated to see how the points standings are going.
He said he looked all over the internet, and there are tons of them out there, but everyone wants too much for them.
Being in the Christmas spirit, I decided to bang one out for him at a $50 discount. That's right...free.
The sheet is fairly straightforward. I've used sheet protection and data validation to ensure users don't "break" the sheet, and I'm using a bunch of conditional formatting to show which games are over, which picks were good ones, etc.
I also included a chart summarizing the current standings at any given point.
The real bonus (to me)is another sheet in the workbook which contains an in-cell tornado chart of each participant's ongoing results. The visual depiction helps you easily understand which picks gave you the most points versus those which did the most damage. Here's an image of those charts:
Merry Christmas, Jason, and merry Christmas to all of you Insiders subscribers who are getting this one, too!
Wednesday, December 20, 2006
The Excel_Geek's Super College Bowl Game Pool Sheet
Monday, November 20, 2006
Good Bye Excel_Geek Blog_Mail, Hello Feedblitz
I'm about to do something risky...
...
...
...
Has anyone ever told you that a bird in hand is worth two in the bush?
For some time now I've offered this service called Excel_Geek Blog_Mail. It was simple: sometimes people would rather read my posts in their email than visit my blog, so I started offering to email subscribers my posts manually (actually using the "Email this post to a friend" feature built into Blogger). You see, atom feeds, XML, RSS, etc., tended to be complicated for many people (me too, I'll admit it). More complicated than many readers were willing to deal with simply to get an email (or equivalent) from little old me.
Over time, I've built up quite a following via Excel_Geek Blog_Mail. Some impressive loyalty, if I can compliment myself by complimenting my subscribers.
Now I'm going to change everything. Excel_Geek Blog_Mail is going away. It's simply too much work for me to do every time I post. I'm sorry. I appreciate all of you dearly, but for a solid hour after each post, I'm clicking and sending. Seriously.
But wait, don't leave. I'm now on Feedblitz, which I learned about through Feedburner. All you have to do to receive all of my posts automatically in your email is type your email address into the little box near the top of the left column of my blog and click the "Subscribe me!" button. Done. That's it. That's even easier than it was to sign up for Blog_Mail!
But what about current Blog_Mail subscribers? Herein lies the risk.
I certainly will not take the liberty with my precious subscribers' emails and sign them up for this myself without their permission. So...I'm asking you to visit my blog again (http://excelgeek.blogspot.com) and sign yourself up via Feedblitz if you want to continue to receive Excel_Geek in your email.
Oh, and if you're not already a Blog_Mail subscriber...you can sign up using Feedblitz anyway. ;)
Later,
Excel_Geek
Wednesday, November 08, 2006
More uses for In-cell Charting - Gantt Charts & Graphic Equalizer Display
I've been playing around for the past few days with other creative ways to utilize the in-cell charting technique I've posted about. Here are two of my current favorites:
1) You can use in-cell charts to create Gantt charts. Let me just say that creating Gantt charts in Excel is hardly breaking any new ground. John Peltier has shown us advanced techniques for doing this using Excel's built in charting feature, and Mr. Excel has shown us how to build Gantt charts using simple conditional formatting. I'm passing this along as just another way to accomplish a similar visual appearance. Below is a small image of what I've done (click on it to open a new window with a larger image):
To create the bars in the chart I use the following formula:

=REPT(" ",D5-G$4)&REPT("█",E5-D5+1)
You can see to accomplish what we need, we first repeat a space (" ") a number of times equal to the start date of the task minus the start of the timeline. Then we repeat ASCII code 219 (hold < ALT > while typing 2 then 1 then 9) a number of times equal to the end date of the task minus the start date of the task + 1. I've also done this one to use conditional formatting to color-code the bars based upon their STATUS. Pretty straightforward, I think.
2) You can use in-cell charting to create graphic displays, such as a graphic equalizer display. Below is a small image of what I've done (click on it to open a new window with a larger image):
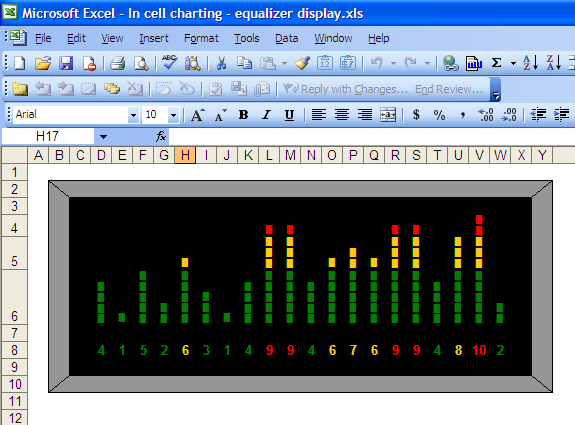
In order to accomplish this look, I have used in-cell charting, only this time I've aligned the "text" (the bar symbols we're using) vertically. Also, since I wanted to have the first 5 bars be green, the next 3 be gold, and the last 2 be red, I've actually split the "bars" into three stacked cells, and adjusted the height of those rows accordingly.
In the lowest segment of each "bar" here's the formula I've used:
=IF(D$8>5,REPT("█",5),REPT("█",D$8))
In the middle segment, here's the formula:
=IF(D$8<6,"",IF(D$8-5>3,REPT("█",3),REPT("█",D$8-5)))
In the topmost segment, here's the formula:
=IF(D$8<9,"",IF(D$8-8>2,REPT("█",2),REPT("█",D$8-8)))
Add to this a little standard formatting with a black background, grey border with diagonal borders drawn on the corners for a 3D effect, and you've got yourself a nice looking graphic equalizer display. The possibilities from here are endless. You could feed this display the bar values dynamically from some other application using VBA, etc.
Additionally, this sort of chart could be used just as well as a regular bar chart in which you want to color-code segments.
I'll be packing up these two sample files and sending them off to my Excel_Geek Insiders subscribers, so you can play around with them and get your own great ideas. Please post a comment on this post if you come up with more cool ideas for in-cell charting.
Later,
Excel_Geek
Friday, October 27, 2006
More In-Cell Charting - Handy Little Add-In Called SparkMaker
I guess you could say the Excel_Geek's on a bit of an in-cell charting kick.
A couple weeks back, though, after reading one of my recent posts on in-cell charting, I reader shot me some information about a handy little Excel add-in called SparkMaker from a German company called Bissantz & Company GmbH.
Now, I think I've said it before, but I'll say it again: one of the single most useful applications for in-cell charting is dashboard reporting -- you know, cramming a lot of trend-type data onto a single page view to give users a quick glance at their overall operations. One thing I hadn't figured out how to do using the in-cell charting techniques I've described previously is how to get an entire trend series of data represented in a chart in a single cell. I mean, each of the "bars" you create in that way "lives" in its own cell. How can I get them all into one cell?
Meet SparkMaker. By using its own set of true type fonts and special functions, SparkMaker can do this in a heartbeat. Check out the image below (click it to open it larger in a new window):
I have an entire series of data that is important to me for trend analysis, though on my dashboard report, I really only need to see the current value, but it would be nice to also get an idea as to what the trend has been. Using SparkMaker, I create an in-cell line chart of the whole series of values. So I can see, "Nearly $49 million in revenues...nice...and it looks like we're on the upswing." All in two cells rather than having to derive it from a series of ten data points or using a big, clunky traditional Excel line chart.
Sparkmaker also does pie charts, which I really like for the same reason. How hard is it to get a traditional Excel pie chart small enough to fit nicely into a dashboard report? Hard. But with SparkMaker, it's a simple formula:

=SparkPie(C5)
Change the font size and color as you like, even dynamically, using conditional formatting, like this (click it to open it larger in a new window):

As I'm typing this I'm thinking of other ways I'd use these pie charts...
Now, at 199.95 (USD) for the "Pro" edition and 59.95 (USD) for the "Basic", SparkMaker is not free, but they do offer a try-it-before-you-buy-it free trial, and I recommend giving it a spin.
Later,
Excel_Geek
Saturday, October 21, 2006
Advanced Excel + VBA Web Queries & Parsing Tips
Those of you who've been reading my blog for some time know that one of the techniques I utilize quite often in completing projects is directly querying web pages using the "MSXML.ServerXMLHTTP" object.
Example:
Set objHTTP = CreateObject("MSXML2.ServerXMLHTTP")
URL = "http://www.somedomain.com"
objHTTP.Open "GET", URL, False
objHTTP.setRequestHeader "User-Agent", "Mozilla/4.0 (compatible; MSIE 6.0; Windows NT 5.0)"
objHTTP.send ("")
This works great for many applications. By simply returning the source HTML code for the web page we've requested...
SourceHTMLText = objHTTP.responseText
...and then using regular expressions to identify specify strings to parse out, you can return specific pieces of text or numeric values from the page.
Say you want to create a spreadsheet containing all of the pertinent data for a specific stock, say Google, from Yahoo Finance. You can simply set the URL you wish to parse to "http://finance.yahoo.com/q?s=goog". Then return the source HTML and parse out the current price, daily change, volume, high, low, etc., returning each of these values to specific cells in the spreadsheet.
Extending this, say you have an entire invenstment portfolio in a spreadsheet and you want to run a script that runs each hour (or day or week or every ten minuntes) and updates each stocks' data. You can simply run multiple queries, making the URL you request a dynamic variable, changing out the ticker symbol in the URL's query string.
But what if you encounter a website that doesn't use URLs with query strings? What if it instead does its database queries "in the background" and then returns the results on a more generic URL?
Example: A website, say http://www.some-fake-gas-price-info-website.com, has a search function that allows visitors to enter a zip code and returns all gas stations in that zip code and their respective fuel prices. Instead of using URLs with query strings that we could access directly -- say, http://www.s-f-g-p-i-w.com?zipcode=12345 -- it returns results on a URL like this: http://www.s-f-g-p-i-w.com/zipcodesearchresults.asp. What do we do? How did we get here?
Take a look at the source HTML for the page on which the search form is located, and look for the code relating specifically to the seach form (where you type in the zip code and click the "search" or "submit" button), which could look something like this:
< form action="zipcodesearch.asp" method="POST" name="zcsearch" id="zcsearch" >
...
< input type="text" size="7" maxlength="5" name="zipcode" value="" >
...
< input type="submit" value="Search" name="btntype" >
...
< / form >
(Note that I aded extra spaces after the "<"s and before the ">"s above to avoid errors when posting this article on this Blogger blog.)
The file specified in the "form action" tag -- "zipcodesearch.asp" -- is the specific page of this website that your zip code is "posted" to in order to generate the http://www.s-f-g-p-i-w.com/zipcodesearchresults.asp page. So what can we do with it?
We can use VBA to post a zip code value to this URL, which will generate the results page, then parse it. It might look something like this:
Set objHTTP = CreateObject("MSXML2.ServerXMLHTTP")
URL = "http://www.s-f-g-p-i-w.com/zipcodesearch.asp"
ZipcodeToPost = "zipcode=12345"
objHTTP.Open "POST", URL, False
objHTTP.setRequestHeader "lastCached", Now()
objHTTP.setRequestHeader "Content-Type", "application/x-www-form-urlencoded"
objHTTP.send ZipcodeToPost
Now you can simply return the source HTML for the resulting page, and parse out the strings containing the data you're after, again using regular expressions.
Easy right?
There are countless ways this sort of technique can be used. Compiling stock price data, weather data, product pricing data, even replicating a portion of a website's underlying database, regardless of what sort of data it contains. I've used this technique to pull down data relating to thousands of U.S. patents, for example. If you know of a website that contains data you're interested in, this technique can likely be used to automatically pull that data down into Excel for you.
Questions? Comments? Concerns? Trying it out but getting stuck? Use my Meembo Me chat feature and shoot me a quick question. And remember, you can always just ask me to do it as a $50 Project.
Later,
Excel_geek
Tuesday, September 26, 2006
In-cell Charting - Tornado Chart Example
I'm sure that most of you, being Excel geeks like me, have heard about the technique to create so-called "in-cell" charts in Excel. The guys over at Juicy Analytics recently had a couple of posts on this subject that garnered a great deal of attention from fellow bloggers, with some people going as far as saying that this technique is superior to the built in feature to be included in Excel 12. I'll hold judgment there until I've personally had more time with Excel 12, but for right now, this in-cell charting technique is certainly a quick, easy, light-weight (to steal a term from the JA guys) means to do some fairly powerful data visualizations.
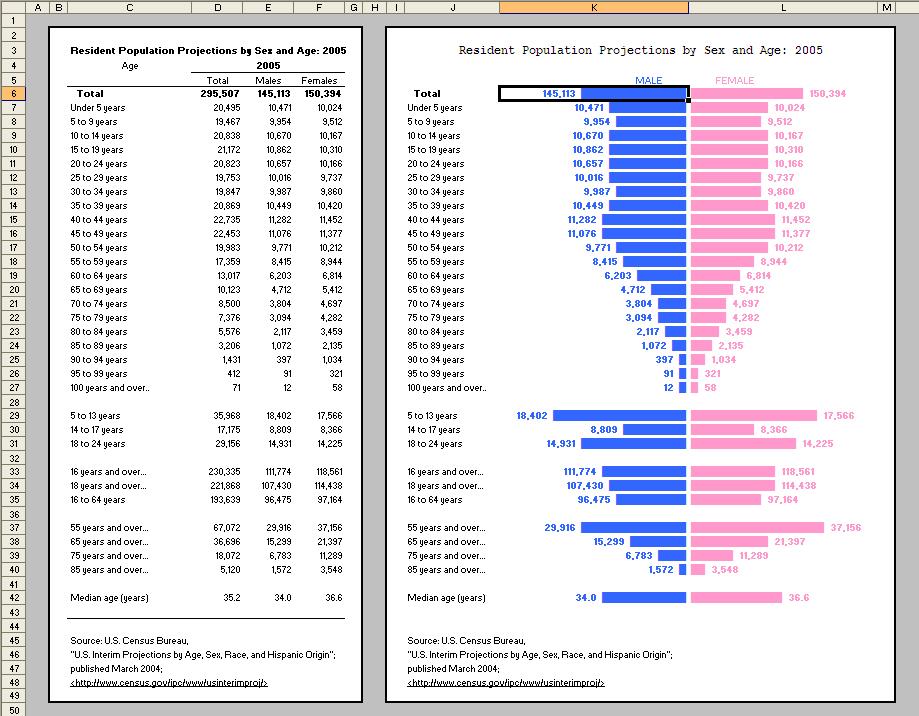
I thought I'd post a demonstration of how using this technique, one can create in-cell "tornado charts" -- a type of chart commonly used to visually depict various data points for two different groups. John Peltier's site shows a nice example of using Excel charts to create tornado charts, which I in no way want to diminish, but here's a simple example of using in-cell charting to do it, too.
A relatively common place to see tornado charts is for census data for men versus women, so I grabbed some quick data from the Statistical Abstract of the United States of America (one of my favorite sources of data) to get me started. Below is a small image of what I created:
(Click the image to view a larger version of the chart.)
See how much more visually appealing data can be in this style of chart?
The formula used in the top, "MALE" column looks like this:
=FIXED(E6,0,FALSE)&" "&REPT("█",ROUNDUP(E6/10000,0))
The special, rectangular character is ASCII code 219. It seems simple and I'm actually a bit embarrassed about it, but it was only recently that I learned that one can use ASCII codes directly in formulas (and in most applications, actually) by simply holding down the ALT key and typing the numeric code. Huh. █ I just did it again. Simple. Anyway, this code provides a nice solid bar.
The cell E6 contains the value I'm visually representing with the bar. Note that I use the FIXED function to display the whole numbers with the commas -- followed by a couple of spaces, then I repeat the ASCII code 219 to make the bar in the chart. Note that I divide the value by 10,000 so that the bar is not too long, then I roundup that value to the nearest whole number. What rounding up in this manner prevents is a situation where, say, the data is 219, and I'm dividing it by 10,000, which if simply rounded to the nearest whole number would result in zero, and therefore show no bar at all, despite there being data greater than zero. Rounding up provides at least one character in the bar to represent relatively small data points.
In the bars immediately following, I divide by only 1,000. Later on, I divide by 2,000, and on the last one, I divide by only 3. Each group is obviously showing a different scale, but it looks nice this way, and still maintains the visual comparison between the MALE and FEMALE data points.
By right-aligning the cells in the MALE column, they line up along the center line. I then repeat a very similar formula in the FEMALE column:
=REPT("█",ROUNDUP(F6/10000,0))&" "&FIXED(F6,0,FALSE)
Note that in this formula the bar comes before the value it represents (since it's on the right), and I align these cells to the left. BLUE vs. PINK color-coding for MALE vs. FEMALE is typical (at least in the United States), so I thought that was a nice touch.
This example is a fairly large chart, but one of the really nice applications for in-cell charting is dashboard reporting, where many times you're trying to squeeze eight or ten or sixteen individual charts into a one page document. In-cell charts can fit that bill very nicely.
I'm very curious to learn if any of you have done cool things with this in-cell charting technique, so please pass along any thoughts or examples -- via commenting on this post, emailing me, or by using my Meebo Me chat feature (Like how it now scrolls up and down with you?). I'll be sending out this example file to my Excel_Geek Insiders subscribers for their enjoyment, as well.
Until later,
Excel_Geek
Friday, September 08, 2006
Example of Recreating a Business Form in Excel
I just recently completed an enhancement on a business form I'd done for an Excel_Geek $50 Project customer from a few months back. John is in the insurance business, and wanted me to replicate in Excel a manual, paper form they use, so that it would be easier/quicker to fill out, not to mention neater when printed out.
I think what I created illustrates several of the key reasons why using Excel to recreate otherwise manual, paper business forms makes good sense.
- Using worksheet protection, we can keep users from inadvertently "breaking" the form.
- Using conditional formating, we can visually cue users which areas in the form they can or need to edit or input data.
- Using data validation, we can ensure that only the appropriate data in the appropriate formats are input into the form. (I even created a "pick from list" data validation that dynamically changed the list based upon selections made in other parts of the form. Oooooohhh Aaaaaahhh!)
- And finally, perhaps one of the most compelling reasons to use Excel to recreate manual business forms is that one can use formulas to automate otherwise tedious calculcations.
All of this, and not a single line of VBA!
Thank you, John, for joining the ranks of the Excel_Geek repeat customer club, and to all of my Insiders subscribers, enjoy this file.
To those of you who haven't yet subscribed to the Insiders program, did you know that when you do, you will receive copies of all the $50 Projects I do for others for a year? All for $39.95 per year. That's right. If I do, say, 20 projects per year, you'll get all 20 for less than $2 each. Why would I give to you for nearly free something for which I charged someone else $50? I little economic principle called "marginal benefit." You see, I've already done the real work, which was paid for, so anything additional I get for that work (while merely having to deliver the product via email) has a relatively high net marginal benefit. Besides, how long do you really think I can offer services worth over $100 per hour for a $50 flat fee without some other revenue streams? After all, there is no such thing as a free lunch.
Can you believe the value! Fantastic examples of Excel and VBA projects AND brilliant lessons in economics, too?!? HA! ;-) Just sign up as an Insider today (if you haven't already)!
Later,
Excel_Geek
Wednesday, August 30, 2006
Another Solution for 1024 Character per Cell Display Problem
Remember back in January when Mike requested a solution for Excel's (pre-Excel 12) 1,024 character per cell display problem? I worked something up for him, but as part of the solution, I inserted new rows and merged cells. Another person let me know that this caused a problem if the cell was part of a table that one wanted to sort.
So...I went to work on a better solution, and I think what I've produced is far superior, though could still be taken further.
Essentially, what I've written checks each cell in a selection to see if it has more than 1024 characters. If it does, it then automatically places line feed characters -- chr(10) in VB -- at the end of each line based upon an approximate number of characters that should fit on each line (only in Arial 10 regular font). It was a bit tricky figuring out how to determine the end of each line -- it could be looking for a space near the approximate end based upon the width of the cell, or a line feed character somewhere before that point.
In the end, it works well. Some possibilities for enhancements? Well, it could be improved to work with any size, name, and style of font. This one converts affected cells to Arial 10 Regular font, which is typically the default font for Excel anyway.
I think those of you who've signed up for my Excel_Geek Insiders service will enjoy it. Just let me know if you need help "strapping" the code on to an existing file you've got. If you haven't already subscribed, you might think about doing so. It's only $39.95 per year, and you get copies of all the file I produce for $50 Project requestors, as well as a few other projects, like this one, that I simply feel like doing.
Interested? Sign up today.
Tuesday, August 29, 2006
My first Excel/VBA Lesson - Sort by Cell Background Color
The other day I was asked by a colleague to teach her the basics of programming in Excel with VBA. Here's the first task I gave her: write a script that a user can call to sort any selected range of cells by the color of their backgrounds. The reason I selected this task is that it seems fairly often written on on the web, so she would be sure to find plenty of examples.
In the end, with some help from me, she produced a fairly tight little script, which I'll be sending it out to those of you who've subscribed to the Excel_Geek Insiders service.
The basics are 1) insert a temporary column next to the range to be sorted, 2) set the value of each cell in that new column equal to the ColorIndex of the cells in the range to be sorted, 3) select the new column and range together, 4) sort by the new column, 5) delete the temporary column, and 6) reselect the original range to be sorted to give users a seemless feel.
Interesting, straightforward approach, I think.
Tuesday, August 22, 2006
Database Project - Web Statistics
Just today I (we, actually) wrapped up a project that WASN'T in Excel. How about that?
A request came in from S _ _ _ _ _ _ , who manages around 1,000 domains. Each month he receives a .DAT file with various statistics for each domain. These files can regularly exceed 5,000 to 10,000 rows of data, so until Excel 12 is in more widespread use, MS Access seemed like the best place for this to live.
I pushed this project out to my growing list of Contributors, and had an immediate taker -- a guy with an extensive database background already. My Contributor turned around the project very fast, complete with functionality to browse for and automatically import the .DAT files, as well as several pre-built simple and crosstab queries. Even better, this Contributor put together a quick instructional sheet illustrated with various screen shots, etc. Nice.
I guess I know where to send off all new incoming database projects, eh?
Seriously, though, thank you S _ _ _ _ _ _ for the project, and thank you Contributor for your quick, comprehensive approach.
Excel_Geek
Friday, August 04, 2006
Manage Google Adwords from Excel
Recently Kelly requested that I build, using Excel, VBA, and the Google Adwords API, a simple means for him/her to manage his/her Adwords account from a spreadsheet. I love the concept, especially for people/businesses that create a long list of ads to manage over time. Basically, the idea is to be able to create and activate new ads, edit existing ads, delete or deactivate ads, etc. from within Excel. Very doable, methinks.
Now, I've not done any projects using the Adwords API, and I'm a bit overloaded on some other projects right now, so I pushed this project out to my vast team of...um...two international Excel_Geek Contributors. Both very capable, but neither has chosen to tackle this particular project.
So...anyone else in the world know how to do this/want to try to do it? Please, become an Excel_Geek Contributor today!
Kelly, if no one out there is willing to step up and help out with this, I'll get to it, but it won't be tomorrow...or next week...but I do want to do this type of work. I might even use it myself.
Excel_Geek
BTW, thank you everyone for your overwhelming response to my new Meebo Me chat feature I installed yesterday. I'll stay signed in as often as possible to help you all with those quick little "How do I (blank) in Excel?" questions that always pop up.
Thursday, August 03, 2006
Meebo the Excel_Geek
New feature!
Sorry I haven't been posting lately. I 've been super busy, and most of the projects I'm working on lately are of the Private Project variety, which doesn't give me much latitude to tell you all about them, but just to give you all some idea of what the heck I'm doing, here are some ultra-brief descriptions:
- a fixed income securities optimizer
- a shipping container optimizer
- an ecommerce site revenue model for scenario analysis
- several custom business forms and a staff scheduler
- code to export a series of Excel charts to image files to use in a mail merge
Now, the real reason for this post: Do you all see it? I've installed a MeeboMe widget on the upper right-hand side of the blog. Super cool. Now, please understand, by their own admission, this thing is a bit buggy right now (sometimes I'm having trouble getting it to show I'm online even when I am), but they'll get those issues worked out, and this will be sweet. When I'm online, you all can shoot me instant messages. Got a quick simple question? Meebo me!
Aren't familiar with Meebo? I suggest reading their blog from start to finish (or skim through it as you've got time). This little company recently landed big venture capital funds to try to figure out a revenue model to support their mutli-instant messaging service aggregating capabilities. I've been following them semi-regularly since near the beginning. I think they may be onto something with this Meebo Me service.
Later,
Excel_Geek
Thursday, May 11, 2006
Return Online Yellow Page Listings to Excel
For a recently requested $50 Project I created a spreadsheet that allows the user to type in the name of a company and an optional state to return a list of online yellow page listings, including company name, address, city, state, zip, and telephone number.
I also created a spreadsheet for this person enabling him to automatically sort by company name, address, city, state, zip, and phone number, as well as automatically apply filters by each of those values, and filter by ranges of zip codes and phone numbers.
How do I get the listing information from the internet to Excel? Well, I wrote a script (using the objHTTP object and regular expressions) that went out to one of the many web-based yellow page services and returned the first page of matches for each company name, along with each associated address and telephone number. After running the code through a list of around 1,800 companies, it retrieved potential matches on roughly half. Not too bad. Beats the heck out of looking up each one manually and copy-pasting the contact info by hand.
All of this took me about 4 hours (programming time and run time included). See the value some of my $50 Project requesters receive!
The script I wrote to get these addresses and phone numbers could be modified to also retrieved websites for those companies listing them, which seemed like around 15-20% of them or so. Also, I could probably also tweak the code to retrieve all company matches for searches done, not by company name, but by business category. That could be valuable, I'd say,
Once a list of company matches were identified, I set up a second spreadsheet to allow this user to automatically sort and apply filters by each of the columns in the list. This could be a simple and effective means of analyzing groups and subgroups of clients, assigning sales or service territories, etc.
Thanks for the project, Ian. I hope you like it.
Excel_Geek
Tuesday, March 21, 2006
Reader Asks: Where does your traffic come from?
Recently an Excel_Geek reader (we'll call her Sue) emailed me. Sue is interested in trying to manage a blog similar to Excel_Geek, offering services related to Microsoft Office Suite products. She wondered how I got going, where the traffic comes from, etc. So, for this reader (and anyone else who might be interested), here goes:
First, let it be known that this takes some time and effort. The days of turning on the website and being flooded with traffic are just gone (for most of us). I started doing this just over a year ago, and I used to get 2, 3, maybe 5 visits a day...TOTAL. So what'd I do? Simple. I kept posting. I tried to talk about relevant stuff that I really knew about. I focused fairly narrowly on my core of VBA proramming specifically for Excel, and hoped that others might find it useful and/or interesting. Once in awhile I'd post about something a bit off center, and sometimes I would be surprised by the results. Currently, my post about the Yahtzee scorecards I created in Excel for my wife still consistently lands in my top ten content posts of all time. Seriously.
I also introduced myself to others out there with apparent interests and expertise in Excel and VBA programming (see the list of links to the left). Did I view these other experts as potential competitors? At first, but then I realized that we're all playing for the same team: the team that wants more people to understand what they can really do with standard software and a tiny bit of knowledge (and perhaps some of our help from time to time).
Did it work? Slowly at first, but I began to get $50 Project requests. Some were interesting and good fodder to post about, and some were less so. Heck, I did some girl's Excel homework for her for $50. Now the second main aspect of my "marketing" plan was put to the test. Word of mouth. I needed to do a great job (and still need to) on all of these projects, since these people could need help later, and would likely tell their friends, family, and colleagues how they "...got this custom programming done for 50, and it works great.." So far, I'm doing well in this respect.
The $50 Projects kept coming in (and continue to) at a faster rate. And I started to see my clientele moving from novices to intermediate Excel users to true "power users." For the most part today, I do work for those who already know how to do most of what they need done, but they just have one or two issues they can't figure out yet. My style of commenting the heck out of my code, providing explanations as to what I've done and why seems to be a huge "selling point" for me.
With an "audience" starting to build I thought it was time to add some other services for these people. I added Excel_Geek Blog_Mail as a great way for regular readers to get my new posts emailed to them automatically for free without havng to figure our RSS feeds, etc., and I added the Insiders program (probably the greatest value I offer), allowing subscribers to get copies of all my $50 Project files completed for the year for less than $40. These services have helped build my audience.
A recent phenomenon is that I'm seeing more and more Private Project requests. Word has apparently gotten out that companies trying to better integrate Excel (and other apps) into their workflows can get access to quality programming services for $50 per hour. While that's not India or Thailand cheap, that's cheap for those not yet ready to offshore this sort of work. And speaking of other countries and "offshoring", my recent move to recruit programming contributors has yielded fruit in the form of my first contributor (from Singapore) signing up and completing his first project -- ahead of the promised delivery date and in higher quality than I could have hoped for. It seems as though I could end up learning more about VBA from my contributors than they'll learn from me!
That's it. That's what I've done and what I'm doing.
To give you some idea about exactly from where my traffic comes, here are some charts I generated from my Google Analytics account:
Here's where my visitors live (this is a sample of 500 visitors, as that's the largest number that Analytics will display for you):
Here's how my traffic breaks down in terms of referrals:
You can see that nearly half of my traffic is referred by search engines and/or directories, a third is direct (they type in my address or have it bookmarked), and 1 in 5 visitors are referred to my by what I'd consider "relevant content providers" -- that is, by other websites or blogs that talk about Excel, VBA, etc. These referrals, to me, are perhaps the most valuable, and my conversion statistics play that out.
Here's how the search engines breakdown:
Adding Blogger into the Google slice, and you've got a more "true" representation of company by company results.
And lastly, here's how my "relevent content provider" referrals break down:
I think this is a good place to pass along my sincerest thanks to...
AndyPope.info
Puremis.net (home of Colo's Excel Junk Room)
Bettersolutions.com
AutomateExcel.com
Excelblog.net
...and many others who've helped me, for helping Excel_Geek become what it's becoming. Thank each one of you.
And so, Sue, here's my one line advice to you: If you want it, do it, but do it hard and with passion if you want any chance to succeed.


Saturday, March 11, 2006
First Completed Contributor Project - We're Truly Global!
Guess what.
Within literally moments of my call for Excel_Geek contributors, I had a taker. And since I had a quick $50 Project ready to go, I fired it off.
The end result? Excel_Geek completed a project for a Canadian by outsourcing it to a Contributor in Singapore. Wow. I'm still amazed a bit myself.
By the way, thanks for the project George. I'm glad we could quickly create that spreadsheet to automatically print out the specifically laid out name tags for your next event. My contributor in Singapore busted out some darned fine code in short order for this. I was truly impressed by the quality of the VBA. This contributor is indeed a fine VBA programmer, doing in 20 or so lines of code what would likely have taken me at least twice that!
Who else wants to be a contributor?
Not only that, who else needs something done in Excel for $50? I've just increased my bandwidth by many times over. Bring 'em on!
Thursday, March 09, 2006
I'm slammed -- World Wide Call for Excel_Geek Contributors
I'd like to apologize, especially to my Excel_Geek Blog_Mail subscribers, for lack of any posts lately. I must confess that I am simply overwhelmed with requests for projects. I've gotten more $50 Projects, and I'll do my best to post about them soon, but lately I've been swamped with "Private Projects" (the ones where people pay $50 per hour rather than a flat $50 in exchange for me not posting about their project on this blog). These projects (in addition to my "real job") has me overwhelmed.
That said, here's what I'd like to pose to the world of other Excel geeks: If you'd like to keep your skills sharp AND learn even more about VBA and Excel AND earn $40 on "flat fee" projects or $40/hour on "private projects (me keeping the difference between $50 and $40), shoot me an email.
I may issue an official policy statement on this program at some time in the future, but for now, this post shall serve as my policy:
This arrangement will be straight broker-type arrangement, me serving as the broker. Project requesters will not know whether it's me or a contributor performing their projects, and the contributors will not know the requesters of the projects. I'll pass project specifications on to contributors, and they'll pass completed projects back to me. Once I'm paid for the project, I'll pass along 80% of the proceeds to the contributor. In terms of which contributor gets to perform each project requested (in the case where several may wish to handle a project), I'll email all contributors with the type (flat fee or hourly rate), specifications, and any stated deadline of each requested project that I do not wish to/have time to/am able to handle myself. Then I'll ask any contributor interested to let me know (via email) of their interest and projected completion date and time (their "bid" let's say). I'd accept these "bids" for 24 hours (unless specifically stated otherwise, say, for ultra-urgent projects). Then the contributor with the fastest projected completion date and time would get the project, and I'd send a confirmation of their assignment of the project via email, as well as let all non-winning bidders know that they are not being assigned the project. In the event of a tie (the same project completion date and time), I'd give the project to the contributor with the better track record of completing projects on time and meeting requester's specifications without revisions. In the event of a tie in "track record" I'll assign the project to the contributor who emailed me first.
What do you think? Who wants to be an Excel_Geek, too?
Saturday, January 28, 2006
Patent Citation Analysis Project Upcoming
Hello everyone.
Thought I'd drop a quick post about an upcoming project that I'll be pursuing soon for my "real job". (I an the Systems Manager for the University of Nebraska - Lincoln's Office of Technology Devlepment, which is the office of the University responsible for commercializing all intellectual properties - patents, etc. - generated through University research.)
What I'll be trying to accomplish using Excel and VBA, and specifically using the objHTTP object to return web pages and regular expressions to parse the text results of those pages, is a homemade system for performing patent citation analysis.
Now, if any of you are familiar with this type of analysis, you'll know that there are many commercially available packages out there, including services from MicroPatent (www.micropat.com), that do this sort of thing, but understand that our office will be using such solutions, and what I'm trying to do is extend that built in functionality.
This ought to be quite interesting in the end (to me, at least).
I'll keep you posted.
Excel_Geek
Sunday, January 22, 2006
Growing International Readership
I wanted to take a moment to send out my appreciation to my growing International audience.
Thank you. Dank u. Merci. Danke. Grazie. Σας ευχαριστούμε. ありがとう. 너를 감사하십시요. Obrigado. Вы. Gracias.
Here's a recent example of the breakdown of my readership (from Google Analytics):
I'm getting more and more international Blog_Mail and Insiders subscribers, and about 20% of all $50 Projects come from Europe.
I've also been getting more and more emails from individuals in the United States and overseas, who'd like to essentially either be a franchisee or reseller of my services. Here's my standard answer:
I do this as a hobby. I make very little money, and in fact, if I were to charge true market rates for this service ($100+ per hour) I'd probably not get enough projects to write about. Plus, I've got a "real job", so I can't spend 50 hours per week on this.
If anyone out there would like to be a franchisee, I'm sorry, but I'm not interested. However, if you'd like to be a contributing programmer/solution provider to keep your skills sharp, email me and I can add you to my growing list of "helpers". How this works is when I get requests for $50 Projects that I am not interested in doing, or I don't have the time for, or I can't figure out myself, I email my list of helpers. If one of them can figure it out, I let them do it, and they email me the solution. I pay them $40, I keep the rest.
If anyone out there would like to be a reseller of Excel_Geek services, again I'm not interested in setting up a formal program. However, if you set up a service whereby you offer to do Excel/VBA projects for, say $100 each, and then turn around and request those projects of me for $50, I can't do anything to stop you. However, know that my standard terms will be in effect.
Later,
Excel_Geek
Tuesday, January 17, 2006
Work Around for 1024 Character Per Cell Display Problem
Here's a recent $50 Project Request that I got from Mike:
Mike was going to use Excel to log transcripts of videos, but he kept running into Excel quirky little 1,024 character display issue. Everyone's probably aware of the current versions of Excel's 1,024 character per cell display problem, right? If you aren't, here's the jist: In Excel '97, '00, '02 and '03, a cell can contain up to 32,767 characters. However, if a cell contains more than 1,024 characters, the following rules apply:
- Characters after approximately the 1,024th character do not appear in the cell; however, they appear in the formula bar when you edit or select the cell.
- Although characters after approximately the 1,024th character do not appear, you can detect and manipulate them with worksheet functions (for example, the RIGHT and MID functions) and macro commands (for example the Characters property).
- If you copy a cell that contains more than 1,024 characters, and then paste them in another cell, all of the characters are pasted into the new cell. However, characters after approximately the 1,024th character do not appear in the destination cell.
- Characters in a cell after approximately the 1,024th character are not printed and may not appear in print preview.
- You may be able to see more than 1,024 characters by increasing the row height and column width of the worksheet, by modifying the display settings of the system, and/or by inserting strategically place hard character returns (ALT+ENTER).
Here's a nice Microsoft article on the topic, if you're interested.
Now, Excel 12 will not have this issue, but Mike likely didn't want to wait for its release then immediately shell out the bucks to upgrade everything, so I set out to write some code that would patch together a clever work around to this problem.
What I basically did was write a macro that would check each cell in the column containing the transcript texts (which are the ones regularly pusing the limit) to see if any of them contained more than 1,024 characters. If one did, I'd add a new row below that one, truncate the long text at 1,024 characters, and place the remainder in the new cell directly below the first one (and repeat if necessary). Then I'd merge the top and bottom cells in all the other columns and format the cells containing the long text so that they visually seemed to be one cell.
Pretty crude, but works great. An intersting note, the .text property of a cell containing the long text only returns the first 1,024 characters, but the .value property returns the actual contents of the cell.
What did Mike end up doing in the end? Well...unfortunately, he decided to use a different program for logging called LLama Log that interfaces with Final Cut Pro quite well and has added some added features that he couldn't readily get in Excel.
Oh well. If anyone else out there wants the project...it's only $50. But of course Excel_Geek Insiders subscribers get all my projects for only $39.95 per year. Sign up today!
Excel_Geek
Thursday, January 12, 2006
UPDATE II on Google API Project
Thought I'd pass along an interesting development with the Google API project requested by S_ _ _ _:
I have been contacted by another party who has alerted me to potential intellectual property issues surrounding this project. I'll not be identifying this party, nor will I make any statements relative to the exact nature of this party's claims, nor my perception of the validity of their claims.
Suffice it to say that I'll not be pursuing this project for hire at this time.
Sorry, S_ _ _ _. $50 isn't worth the risk.
Excel_Geek


