I'm sure that most of you, being Excel geeks like me, have heard about the technique to create so-called "in-cell" charts in Excel. The guys over at Juicy Analytics recently had a couple of posts on this subject that garnered a great deal of attention from fellow bloggers, with some people going as far as saying that this technique is superior to the built in feature to be included in Excel 12. I'll hold judgment there until I've personally had more time with Excel 12, but for right now, this in-cell charting technique is certainly a quick, easy, light-weight (to steal a term from the JA guys) means to do some fairly powerful data visualizations.
I thought I'd post a demonstration of how using this technique, one can create in-cell "tornado charts" -- a type of chart commonly used to visually depict various data points for two different groups. John Peltier's site shows a nice example of using Excel charts to create tornado charts, which I in no way want to diminish, but here's a simple example of using in-cell charting to do it, too.
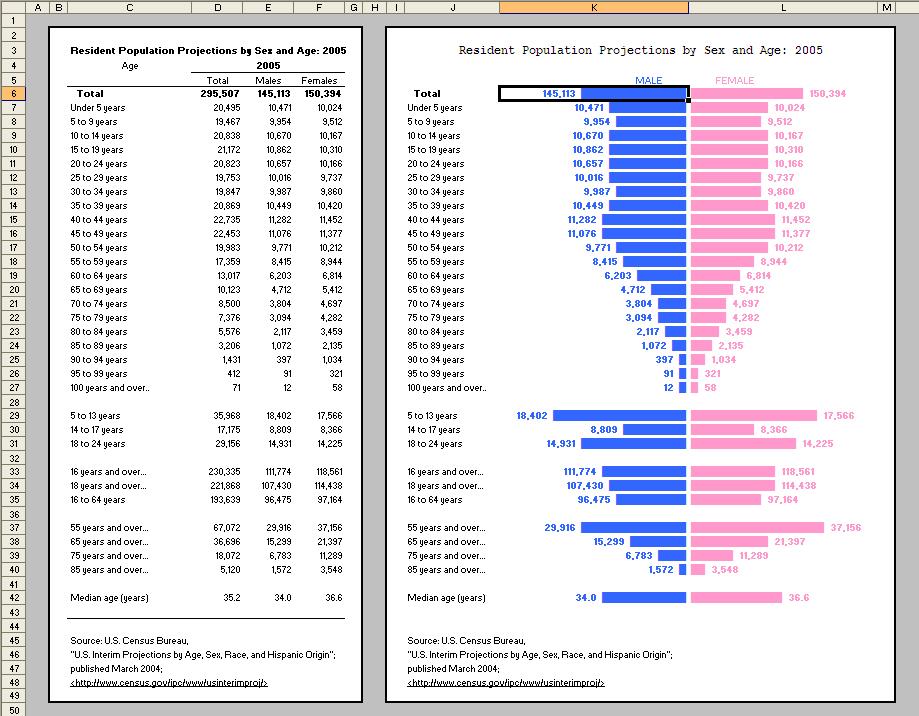
A relatively common place to see tornado charts is for census data for men versus women, so I grabbed some quick data from the Statistical Abstract of the United States of America (one of my favorite sources of data) to get me started. Below is a small image of what I created:
(Click the image to view a larger version of the chart.)
See how much more visually appealing data can be in this style of chart?
The formula used in the top, "MALE" column looks like this:
=FIXED(E6,0,FALSE)&" "&REPT("█",ROUNDUP(E6/10000,0))
The special, rectangular character is ASCII code 219. It seems simple and I'm actually a bit embarrassed about it, but it was only recently that I learned that one can use ASCII codes directly in formulas (and in most applications, actually) by simply holding down the ALT key and typing the numeric code. Huh. █ I just did it again. Simple. Anyway, this code provides a nice solid bar.
The cell E6 contains the value I'm visually representing with the bar. Note that I use the FIXED function to display the whole numbers with the commas -- followed by a couple of spaces, then I repeat the ASCII code 219 to make the bar in the chart. Note that I divide the value by 10,000 so that the bar is not too long, then I roundup that value to the nearest whole number. What rounding up in this manner prevents is a situation where, say, the data is 219, and I'm dividing it by 10,000, which if simply rounded to the nearest whole number would result in zero, and therefore show no bar at all, despite there being data greater than zero. Rounding up provides at least one character in the bar to represent relatively small data points.
In the bars immediately following, I divide by only 1,000. Later on, I divide by 2,000, and on the last one, I divide by only 3. Each group is obviously showing a different scale, but it looks nice this way, and still maintains the visual comparison between the MALE and FEMALE data points.
By right-aligning the cells in the MALE column, they line up along the center line. I then repeat a very similar formula in the FEMALE column:
=REPT("█",ROUNDUP(F6/10000,0))&" "&FIXED(F6,0,FALSE)
Note that in this formula the bar comes before the value it represents (since it's on the right), and I align these cells to the left. BLUE vs. PINK color-coding for MALE vs. FEMALE is typical (at least in the United States), so I thought that was a nice touch.
This example is a fairly large chart, but one of the really nice applications for in-cell charting is dashboard reporting, where many times you're trying to squeeze eight or ten or sixteen individual charts into a one page document. In-cell charts can fit that bill very nicely.
I'm very curious to learn if any of you have done cool things with this in-cell charting technique, so please pass along any thoughts or examples -- via commenting on this post, emailing me, or by using my Meebo Me chat feature (Like how it now scrolls up and down with you?). I'll be sending out this example file to my Excel_Geek Insiders subscribers for their enjoyment, as well.
Until later,
Excel_Geek
Tuesday, September 26, 2006
In-cell Charting - Tornado Chart Example

Friday, September 08, 2006
Example of Recreating a Business Form in Excel
I just recently completed an enhancement on a business form I'd done for an Excel_Geek $50 Project customer from a few months back. John is in the insurance business, and wanted me to replicate in Excel a manual, paper form they use, so that it would be easier/quicker to fill out, not to mention neater when printed out.
I think what I created illustrates several of the key reasons why using Excel to recreate otherwise manual, paper business forms makes good sense.
- Using worksheet protection, we can keep users from inadvertently "breaking" the form.
- Using conditional formating, we can visually cue users which areas in the form they can or need to edit or input data.
- Using data validation, we can ensure that only the appropriate data in the appropriate formats are input into the form. (I even created a "pick from list" data validation that dynamically changed the list based upon selections made in other parts of the form. Oooooohhh Aaaaaahhh!)
- And finally, perhaps one of the most compelling reasons to use Excel to recreate manual business forms is that one can use formulas to automate otherwise tedious calculcations.
All of this, and not a single line of VBA!
Thank you, John, for joining the ranks of the Excel_Geek repeat customer club, and to all of my Insiders subscribers, enjoy this file.
To those of you who haven't yet subscribed to the Insiders program, did you know that when you do, you will receive copies of all the $50 Projects I do for others for a year? All for $39.95 per year. That's right. If I do, say, 20 projects per year, you'll get all 20 for less than $2 each. Why would I give to you for nearly free something for which I charged someone else $50? I little economic principle called "marginal benefit." You see, I've already done the real work, which was paid for, so anything additional I get for that work (while merely having to deliver the product via email) has a relatively high net marginal benefit. Besides, how long do you really think I can offer services worth over $100 per hour for a $50 flat fee without some other revenue streams? After all, there is no such thing as a free lunch.
Can you believe the value! Fantastic examples of Excel and VBA projects AND brilliant lessons in economics, too?!? HA! ;-) Just sign up as an Insider today (if you haven't already)!
Later,
Excel_Geek
Wednesday, August 30, 2006
Another Solution for 1024 Character per Cell Display Problem
Remember back in January when Mike requested a solution for Excel's (pre-Excel 12) 1,024 character per cell display problem? I worked something up for him, but as part of the solution, I inserted new rows and merged cells. Another person let me know that this caused a problem if the cell was part of a table that one wanted to sort.
So...I went to work on a better solution, and I think what I've produced is far superior, though could still be taken further.
Essentially, what I've written checks each cell in a selection to see if it has more than 1024 characters. If it does, it then automatically places line feed characters -- chr(10) in VB -- at the end of each line based upon an approximate number of characters that should fit on each line (only in Arial 10 regular font). It was a bit tricky figuring out how to determine the end of each line -- it could be looking for a space near the approximate end based upon the width of the cell, or a line feed character somewhere before that point.
In the end, it works well. Some possibilities for enhancements? Well, it could be improved to work with any size, name, and style of font. This one converts affected cells to Arial 10 Regular font, which is typically the default font for Excel anyway.
I think those of you who've signed up for my Excel_Geek Insiders service will enjoy it. Just let me know if you need help "strapping" the code on to an existing file you've got. If you haven't already subscribed, you might think about doing so. It's only $39.95 per year, and you get copies of all the file I produce for $50 Project requestors, as well as a few other projects, like this one, that I simply feel like doing.
Interested? Sign up today.
Tuesday, August 29, 2006
My first Excel/VBA Lesson - Sort by Cell Background Color
The other day I was asked by a colleague to teach her the basics of programming in Excel with VBA. Here's the first task I gave her: write a script that a user can call to sort any selected range of cells by the color of their backgrounds. The reason I selected this task is that it seems fairly often written on on the web, so she would be sure to find plenty of examples.
In the end, with some help from me, she produced a fairly tight little script, which I'll be sending it out to those of you who've subscribed to the Excel_Geek Insiders service.
The basics are 1) insert a temporary column next to the range to be sorted, 2) set the value of each cell in that new column equal to the ColorIndex of the cells in the range to be sorted, 3) select the new column and range together, 4) sort by the new column, 5) delete the temporary column, and 6) reselect the original range to be sorted to give users a seemless feel.
Interesting, straightforward approach, I think.
Tuesday, August 22, 2006
Database Project - Web Statistics
Just today I (we, actually) wrapped up a project that WASN'T in Excel. How about that?
A request came in from S _ _ _ _ _ _ , who manages around 1,000 domains. Each month he receives a .DAT file with various statistics for each domain. These files can regularly exceed 5,000 to 10,000 rows of data, so until Excel 12 is in more widespread use, MS Access seemed like the best place for this to live.
I pushed this project out to my growing list of Contributors, and had an immediate taker -- a guy with an extensive database background already. My Contributor turned around the project very fast, complete with functionality to browse for and automatically import the .DAT files, as well as several pre-built simple and crosstab queries. Even better, this Contributor put together a quick instructional sheet illustrated with various screen shots, etc. Nice.
I guess I know where to send off all new incoming database projects, eh?
Seriously, though, thank you S _ _ _ _ _ _ for the project, and thank you Contributor for your quick, comprehensive approach.
Excel_Geek
Friday, August 04, 2006
Manage Google Adwords from Excel
Recently Kelly requested that I build, using Excel, VBA, and the Google Adwords API, a simple means for him/her to manage his/her Adwords account from a spreadsheet. I love the concept, especially for people/businesses that create a long list of ads to manage over time. Basically, the idea is to be able to create and activate new ads, edit existing ads, delete or deactivate ads, etc. from within Excel. Very doable, methinks.
Now, I've not done any projects using the Adwords API, and I'm a bit overloaded on some other projects right now, so I pushed this project out to my vast team of...um...two international Excel_Geek Contributors. Both very capable, but neither has chosen to tackle this particular project.
So...anyone else in the world know how to do this/want to try to do it? Please, become an Excel_Geek Contributor today!
Kelly, if no one out there is willing to step up and help out with this, I'll get to it, but it won't be tomorrow...or next week...but I do want to do this type of work. I might even use it myself.
Excel_Geek
BTW, thank you everyone for your overwhelming response to my new Meebo Me chat feature I installed yesterday. I'll stay signed in as often as possible to help you all with those quick little "How do I (blank) in Excel?" questions that always pop up.
Thursday, August 03, 2006
Meebo the Excel_Geek
New feature!
Sorry I haven't been posting lately. I 've been super busy, and most of the projects I'm working on lately are of the Private Project variety, which doesn't give me much latitude to tell you all about them, but just to give you all some idea of what the heck I'm doing, here are some ultra-brief descriptions:
- a fixed income securities optimizer
- a shipping container optimizer
- an ecommerce site revenue model for scenario analysis
- several custom business forms and a staff scheduler
- code to export a series of Excel charts to image files to use in a mail merge
Now, the real reason for this post: Do you all see it? I've installed a MeeboMe widget on the upper right-hand side of the blog. Super cool. Now, please understand, by their own admission, this thing is a bit buggy right now (sometimes I'm having trouble getting it to show I'm online even when I am), but they'll get those issues worked out, and this will be sweet. When I'm online, you all can shoot me instant messages. Got a quick simple question? Meebo me!
Aren't familiar with Meebo? I suggest reading their blog from start to finish (or skim through it as you've got time). This little company recently landed big venture capital funds to try to figure out a revenue model to support their mutli-instant messaging service aggregating capabilities. I've been following them semi-regularly since near the beginning. I think they may be onto something with this Meebo Me service.
Later,
Excel_Geek


